
Page 104 - Bilancio Sostenibilità Ratti 2020_en
P. 104
Methodological note
The criteria of this Report 103
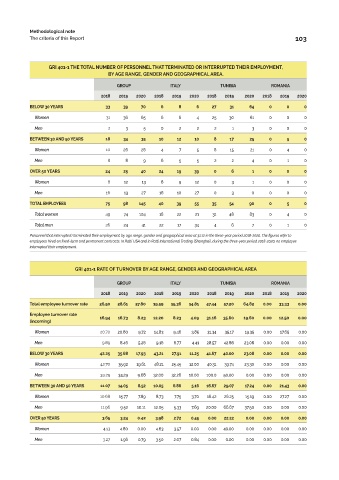
GRI 401-1 THE TOTAL NUMBER OF PERSONNEL THAT TERMINATED OR INTERRUPTED THEIR EMPLOYMENT,
BY AGE RANGE, GENDER AND GEOGRAPHICAL AREA.
GROUP ITALY TUNISIA ROMANIA
2018 2019 2020 2018 2019 2020 2018 2019 2020 2018 2019 2020
BELOW 30 YEARS 33 39 70 6 8 6 27 31 64 0 0 0
Women 31 36 65 6 6 4 25 30 61 0 0 0
Men 2 3 5 0 2 2 2 1 3 0 0 0
BETWEEN 30 AND 50 YEARS 18 34 35 10 12 10 8 17 25 0 5 0
Women 10 26 26 4 7 5 6 15 21 0 4 0
Men 8 8 9 6 5 5 2 2 4 0 1 0
OVER 50 YEARS 24 25 40 24 19 39 0 6 1 0 0 0
Women 8 12 13 8 9 12 0 3 1 0 0 0
Men 16 13 27 16 10 27 0 3 0 0 0 0
TOTAL EMPLOYEES 75 98 145 40 39 55 35 54 90 0 5 0
Total women 49 74 104 18 22 21 31 48 83 0 4 0
Total men 26 24 41 22 17 34 4 6 7 0 1 0
Personnel that interrupted/terminated their employment, by age range, gender and geographical area at 31.12 in the three-year period 2018-2020. The figures refer to
employees hired on fixed-term and permanent contracts. In Ratti USA and in Ratti International Trading (Shanghai), during the three-year period 2018-2020, no employee
interrupted their employment.
GRI 401-1 RATE OF TURNOVER BY AGE RANGE, GENDER AND GEOGRAPHICAL AREA
GROUP ITALY TUNISIA ROMANIA
2018 2019 2020 2018 2019 2020 2018 2019 2020 2018 2019 2020
Total employee turnover rate 26.50 28.61 27.80 19.59 15.36 14.81 47.44 57.20 64.82 0.00 33.33 0.00
Employee turnover rate
16.94 16.73 8.23 12.20 8.23 4.09 31.16 35.60 19.60 0.00 12.50 0.00
(incoming)
Women 20.70 20.80 9.72 14.83 9.46 3.85 31.34 35.17 19.35 0.00 17.65 0.00
Men 9.89 8.46 5.26 9.16 6.77 4.41 28.57 42.86 23.08 0.00 0.00 0.00
BELOW 30 YEARS 42.25 35.68 17.93 43.21 27.91 11.25 41.67 40.00 23.08 0.00 0.00 0.00
Women 42.70 35.92 19.61 48.21 25.45 12.00 40.31 39.74 23.30 0.00 0.00 0.00
Men 39.29 34.29 9.68 32.00 32.26 10.00 100.0 50.00 0.00 0.00 0.00 0.00
BETWEEN 30 AND 50 YEARS 11.07 14.05 8.52 10.05 6.86 5.16 16.67 29.07 17.24 0.00 21.43 0.00
Women 10.68 15.77 7.89 8.73 7.75 3.70 16.42 26.25 15.19 0.00 27.27 0.00
Men 11.96 9.52 10.11 12.05 5.33 7.69 20.00 66.67 37.50 0.00 0.00 0.00
OVER 50 YEARS 3.65 3.24 0.42 3.98 2.72 0.45 0.00 22.22 0.00 0.00 0.00 0.00
Women 4.13 4.80 0.00 4.63 3.57 0.00 0.00 40.00 0.00 0.00 0.00 0.00
Men 3.27 1.96 0.79 3.50 2.07 0.84 0.00 0.00 0.00 0.00 0.00 0.00