
Page 108 - Ratti_bilancio di sostenibilità_2020
P. 108
Gruppo Ratti
Bilancio di sostenibilità 2020
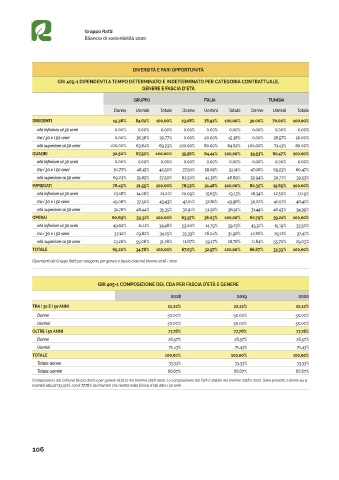
DIVERSITÀ E PARI OPPORTUNITÀ
GRI 405-1 DIPENDENTI A TEMPO DETERMINATO E INDETERMINATO PER CATEGORIA CONTRATTUALE,
GENERE E FASCIA D’ETÀ
GRUPPO ITALIA TUNISIA
Donne Uomini Totale Donne Uomini Totale Donne Uomini Totale
DIRIGENTI 15,38% 84,62% 100,00% 23,08% 76,92% 100,00% 30,00% 70,00% 100,00%
età inferiore ai 30 anni 0,00% 0,00% 0,00% 0,00% 0,00% 0,00% 0,00% 0,00% 0,00%
tra i 30 e i 50 anni 0,00% 36,36% 30,77% 0,00% 20,00% 15,38% 0,00% 28,57% 20,00%
età superiore ai 50 anni 100,00% 63,64% 69,23% 100,00% 80,00% 84,62% 100,00% 71,43% 80,00%
QUADRI 32,50% 67,50% 100,00% 35,56% 64,44% 100,00% 39,53% 60,47% 100,00%
età inferiore ai 30 anni 0,00% 0,00% 0,00% 0,00% 0,00% 0,00% 0,00% 0,00% 0,00%
tra i 30 e i 50 anni 30,77% 48,15% 42,50% 37,50% 58,62% 51,11% 47,06% 69,23% 60,47%
età superiore ai 50 anni 69,23% 51,85% 57,50% 62,50% 41,38% 48,89% 52,94% 30,77% 39,53%
IMPIEGATI 78,45% 21,55% 100,00% 78,52% 21,48% 100,00% 80,35% 19,65% 100,00%
età inferiore ai 30 anni 23,18% 14,06% 21,21% 20,09% 15,63% 19,13% 18,34% 12,50% 17,19%
tra i 30 e i 50 anni 45,06% 37,50% 43,43% 47,01% 32,81% 43,96% 50,22% 41,07% 48,42%
età superiore ai 50 anni 31,76% 48,44% 35,35% 32,91% 51,56% 36,91% 31,44% 46,43% 34,39%
OPERAI 60,69% 39,31% 100,00% 63,97% 36,03% 100,00% 60,79% 39,21% 100,00%
età inferiore ai 30 anni 49,62% 11,11% 34,48% 53,00% 14,79% 39,23% 45,31% 15,19% 33,50%
tra i 30 e i 50 anni 37,12% 29,82% 34,25% 35,33% 26,04% 31,98% 42,86% 29,11% 37,47%
età superiore ai 50 anni 13,26% 59,06% 31,26% 11,67% 59,17% 28,78% 11,84% 55,70% 29,03%
TOTALE 65,22% 34,78% 100,00% 67,03% 32,97% 100,00% 66,67% 33,33% 100,00%
Dipendenti del Gruppo Ratti per categoria, per genere e fascia d’età nel triennio 2018 - 2020.
GRI 405-1 COMPOSIZIONE DEL CDA PER FASCIA D’ETÀ E GENERE
2018 2019 2020
TRA I 30 E I 50 ANNI 22,22% 22,22% 22,22%
Donne 50,00% 50,00% 50,00%
Uomini 50,00% 50,00% 50,00%
OLTRE I 50 ANNI 77,78% 77,78% 77,78%
Donne 28,57% 28,57% 28,57%
Uomini 71,43% 71,43% 71,43%
TOTALE 100,00% 100,00% 100,00%
Totale donne 33,33% 33,33% 33,33%
Totale uomini 66,67% 66,67% 66,67%
Composizione del CdA per fascia d’età e per genere al 31.12 nel triennio 2018-2020. La composizione del CdA è stabile nel triennio 2018 e 2020. Sono presenti 3 donne sui 9
membri attuali (33,33%), con il 77,78% dei membri che rientra nella fascia d’età oltre i 50 anni.
106