
Page 123 - Ratti_bilancio di sostenibilità_2021_en
P. 123
THE CRITERIA OF THIS REPORT | ANNEX
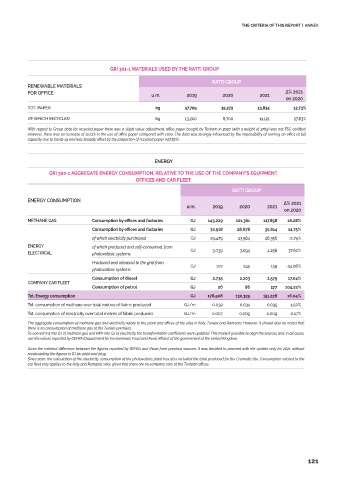
GRI 301-1 MATERIALS USED BY THE RATTI GROUP
RATTI GROUP
RENEWABLE MATERIALS
FOR OFFICE u.m. 2019 2020 2021 Δ% 2021
on 2020
TOT. PAPER kg 17,709 12,272 13,834 12.73%
OF WHICH RECYCLED kg 13,200 8,700 11,121 27.83%
With regard to Group data for recycled paper there was a slight value adjustment: office paper bought by Textrom in 2020 (with a weight of 37kg) was not FSC certified.
However, there was an increase of 12.73% in the use of office paper compared with 2020. The data was strongly influenced by the impossibility of running an office at full
capacity due to Covid-19 and was broadly offset by the proportion of recycled paper (+27.83%).
ENERGY
GRI 302-1 AGGREGATE ENERGY CONSUMPTION, RELATIVE TO THE USE OF THE COMPANY’S EQUIPMENT,
OFFICES AND CAR FLEET.
RATTI GROUP
ENERGY CONSUMPTION Δ% 2021
u.m. 2019 2020 2021
on 2020
METHANE GAS Consumption by offices and factories GJ 143,229 101,361 117,858 16.28%
Consumption by offices and factories GJ 32,518 26,678 30,614 14.75%
of which electricity purchased GJ 29,479 23,584 26,356 11.75%
ENERGY of which produced and self-consumed, from
ELECTRICAL photovoltaic systems GJ 3,039 3,094 4,258 37.62%
Produced and released to the grid from
GJ 107 245 159 -34.96%
photovoltaic systems
Consumption of diesel GJ 2,735 2,203 2,579 17.04%
COMPANY CAR FLEET
Consumption of petrol GJ 26 86 177 104.22%
Tot. Energy consumption GJ 178,508 130,329 151.228 16,04%
Tot. consumption of methane over total metres of fabric produced GJ/m 0.032 0.034 0.035 1.50%
Tot. consumption of electricity over total metres of fabric produced GJ/m 0.007 0.009 0.009 0.17%
The aggregate consumption of methane gas and electricity relate to the plant and offices of the sites in Italy, Tunisia and Romania. However, it should also be noted that
there is no consumption of methane gas at the Tunisia premises.
To convert m3 into GJ of methane gas and kWh into GJ of electricity, the transformation coefficients were updated. This made it possible to align the sources and, in all cases,
use the values reported by DEFRA (Department for Environment, Food and Rural Affairs) of the government of the United Kingdom.
Given the minimal difference between the figures reported by DEFRA and those from previous sources, it was decided to proceed with the update only for 2021, without
recalculating the figures in GJ for 2020 and 2019.
Since 2020, the calculation of the electricity consumption of the photovoltaic plant has also included the total produced for the Cremoda site. Consumption related to the
car fleet only applies to the Italy and Romania sites, given that there are no company cars at the Tunisian offices.
121