
Page 124 - Ratti_bilancio di sostenibilità_2021_en
P. 124
RATTI GROUP | SUSTAINABILITY REPORT 2021
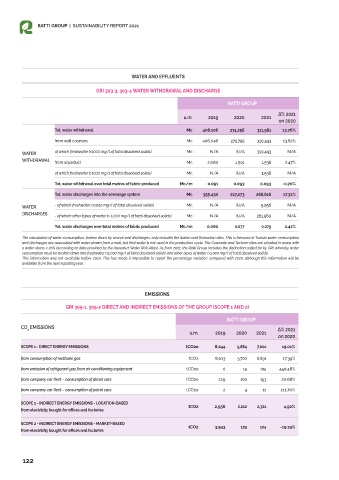
WATER AND EFFLUENTS
GRI 303-3, 303-4 WATER WITHDRAWAL AND DISCHARGE
RATTI GROUP
Δ% 2021
u.m. 2019 2020 2021
on 2020
Tot. water withdrawal Mc 408,106 274,256 311,981 13.76%
from well counters Mc 406,046 272,755 310,443 13.82%
WATER of which freshwater (≤1000 mg/l of total dissolved solids) Mc N/A N/A 310,443 N/A
WITHDRAWAL from aqueduct Mc 2,060 1,501 1,538 2.47%
of which freshwater (≤1000 mg/l of total dissolved solids) Mc N/A N/A 1,538 N/A
Tot. water withdrawal over total metres of fabric produced Mc/m 0.091 0.093 0.093 -0.70%
Tot. water discharges into the sewerage system Mc 355,430 227,273 266,616 17.31%
WATER - of which freshwater (≤1000 mg/l of total dissolved solids) Mc N/A N/A 5,056 N/A
DISCHARGES - of which other types of water (> 1,000 mg/l of total dissolved solids) Mc N/A N/A 261,560 N/A
Tot. water discharges over total metres of fabric produced Mc/m 0.080 0.077 0.079 2.41%
The calculation of water consumption, broken down by source and discharges, only includes the Italian and Romanian sites. This is because in Tunisia water consumption
and discharges are associated with water drawn from a well, but that water is not used in the production cycle. The Guanzate and Textrom sites are situated in areas with
a water stress < 20% (according to data provided by the Aqueduct Water Risk Atlas). As from 2021, the Ratti Group includes the distinction called for by GRI, whereby water
consumption must be broken down into freshwater (≤1,000 mg/l of total dissolved solids) and other types of water (>1,000 mg/l of total dissolved solids).
This information was not available before 2020. This has made it impossible to report the percentage variation compared with 2020, although this information will be
available from the next reporting year.
EMISSIONS
GRI 305-1, 305-2 DIRECT AND INDIRECT EMISSIONS OF THE GROUP (SCOPE 1 AND 2)
RATTI GROUP
CO EMISSIONS
2 Δ% 2021
u.m. 2019 2020 2021
on 2020
SCOPE 1 - DIRECT ENERGY EMISSIONS tCO2e 8,244 5,884 7,001 19.01%
from consumption of methane gas tCO2 8,013 5,700 6,691 17.39%
from emission of refrigerant gas from air conditioning equipment tCO2e 0 19 105 450.48%
from company car fleet – consumption of diesel cars tCO2e 229 160 193 20.68%
from company car fleet – consumption of petrol cars tCO2e 2 4 12 211.70%
SCOPE 2 - INDIRECT ENERGY EMISSIONS - LOCATION-BASED
tCO2 2,956 2,212 2,321 4.92%
from electricity bought for offices and factories
SCOPE 2 - INDIRECT ENERGY EMISSIONS - MARKET-BASED
tCO2 3,943 129 104 -19.19%
from electricity bought for offices and factories
122