
Page 111 - Bilancio Sostenibilità Ratti 2020_en
P. 111
Ratti Group
Sustainability report 2020
ENERGY
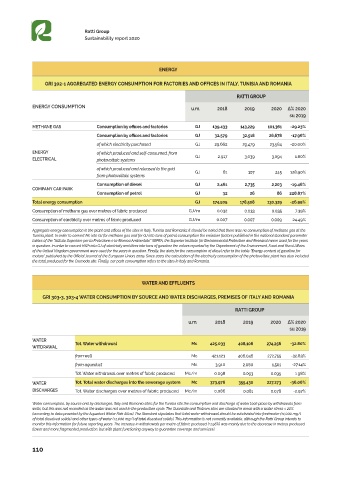
GRI 302-1 AGGREGATED ENERGY CONSUMPTION FOR FACTORIES AND OFFICES IN ITALY, TUNISIA AND ROMANIA
RATTI GROUP
ENERGY CONSUMPTION u.m. 2018 2019 2020 Δ% 2020
su 2019
METHANE GAS Consumption by offices and factories GJ 139,433 143,229 101,361 -29.23%
Consumption by offices and factories GJ 32,579 32,518 26,678 -17.96%
of which electricity purchased GJ 29,662 29,479 23,584 -20.00%
ENERGY of which produced and self-consumed, from
ELECTRICAL photovoltaic systems GJ 2,917 3,039 3,094 1.80%
of which produced and released to the grid GJ 81 107 245 128.90%
from photovoltaic systems
Consumption of diesel GJ 2,461 2,735 2,203 -19.46%
COMPANY CAR PARK
Consumption of petrol GJ 32 26 86 228.87%
Total energy consumption GJ 174,505 178,508 130,329 -26.99%
Consumption of methane gas over metres of fabric produced GJ/m 0.032 0.033 0.035 7.39%
Consumption of electricity over metres of fabric produced GJ/m 0.007 0.007 0.009 24.49%
Aggregate energy consumption in the plant and offices of the sites in Italy, Tunisia and Romania; it should be noted that there was no consumption of methane gas at the
Tunisia plant. In order to convert Mc into GJ for methane gas and for GJ into tons of petrol consumption the emission factors published in the national standard parameter
tables of the “Istituto Superiore per la Protezione e la Ricerca Ambientale” (ISPRA, the Superior Institute for Environmental Protection and Research) were used for the years
in question. In order to convert kWh into GJ of electricity and litres into tons of gasoline the values reported by the Department of the Environment, Food and Rural Affairs
of the United Kingdom government were used for the years in question. Finally, the data for the consumption of diesel refer to the table “Energy content of gasoline for
motors” published by the Official Journal of the European Union, 2009. Since 2020, the calculation of the electricity consumption of the photovoltaic plant has also included
the total produced for the Cremoda site. Finally, car park consumption refers to the sites in Italy and Romania.
WATER AND EFFLUENTS
GRI 303-3, 303-4 WATER CONSUMPTION BY SOURCE AND WATER DISCHARGES, PREMISES OF ITALY AND ROMANIA
RATTI GROUP
u.m. 2018 2019 2020 Δ% 2020
su 2019
WATER
Tot. Water withdrawal Mc 425,033 408,106 274,256 -32.80%
WITDRAWAL
from well Mc 421,123 406,046 272,755 -32.83%
from aqueduct Mc 3,910 2,060 1,501 -27.14%
Tot. Water withdrawal over metres of fabric produced Mc/m 0.098 0.093 0.095 1.98%
WATER Tot. Total water discharges into the sewerage system Mc 373,976 355,430 227,273 -36.06%
DISCHARGES Tot. Water discharges over metres of fabric produced Mc/m 0,086 0,081 0,078 -2,97%
Water consumption, by source and by discharges, Italy and Romania sites; for the Tunisia site the consumption and discharge of water took place by withdrawals from
wells, but this was not recorded as the water was not used in the production cycle. The Guanzate and Textrom sites are situated in areas with a water stress < 20%
(according to data provided by the Aqueduct Water Risk Atlas). The Standard stipulates that total water withdrawal should be subdivided into freshwater (≤1,000 mg/l
of total dissolved solids) and other types of water (>1,000 mg/l of total dissolved solids). This information is not currently available, although the Ratti Group intends to
monitor this information for future reporting years. The increase in withdrawals per metre of fabric produced (+1.98%) was mainly due to the decrease in metres produced
(lower and more fragmented production, but with plant functioning anyway to guarantee coverage and services).
110