
Page 24 - Ratti_bilancio di sostenibilità_2021_en
P. 24
RATTI GROUP | SUSTAINABILITY REPORT 2021
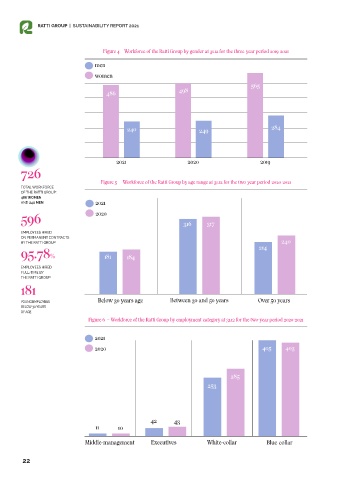
Figure 4 – Workforce of the Ratti Group by gender at 31.12 for the three-year period 2019-2021
men
women
565
486 498
240 249 284
2021 2020 2019
726
Figure 5 – Workforce of the Ratti Group by age range at 31.12 for the two-year period 2020-2021
TOTAL WORKFORCE
OF THE RATTI GROUP:
486 WOMEN
AND 240 MEN 2021
596 2020 316 317
EMPLOYEES HIRED
ON PERMANENT CONTRACTS
BY THE RATTI GROUP 214 240
95.78% 181 184
EMPLOYEES HIRED
FULL-TIME BY
THE RATTI GROUP
181
YOUNG EMPLOYEES Below 30 years age Between 30 and 50 years Over 50 years
BELOW 30 YEARS
OF AGE
Figure 6 – Workforce of the Ratti Group by employment category at 31.12 for the two-year period 2020-2021
2021
2020 405 403
285
253
42 43
11 10
Middle-management Executives White-collar Blue-collar
22