Page 93 - Bilancio Sostenibilità Ratti 2020_en
P. 93

Ratti Group
                               Sustainability report 2020


                               The following table shows, in thousands of
                               euros, the economic value directly generated by
                               the Ratti Group and distributed to internal and
                               external stakeholders.


                    Table 9 – Economic value directly generated, distributed and held by the Ratti Group at 31.12 for the two years 2019 and 2020.
                Amounts are in thousands of euros

                                                                                  2020       2019 Δ% 2020 su 2019
                DIRECTLY GENERATED ECONOMIC VALUE                               68,717    117,808      -41.67%

                Revenues from sales of goods and services                        71,236    116,278     -38.74%
                Change in stock and work in progress                             -4,203      -294     1329.59%
                Changes in fixed assets by internal works                          84          0            -
                Other revenues and net income                                     1,196      1,354      -11.67%
                Financial income                                                  404         470      -14.04%
                ECONOMIC VALUE DISTRIBUTED                                      62,975     100,316     -37.22%
                Operating costs (for the acquisition of raw materials, subsidiary materials, consumables,
                goods, and for third-party services and leases and rentals)      35,847     63,065     -43.16%
                Salaries paid to employees, including social security contributions, TFR   25,559  32,740  -21.93%
                (employee severance fund) and other costs
                Interest payable on loans and other forms of debt                 869        1,024      -15.14%
                Dividends distributed                                               0          0            -
                Income taxes and other tax liabilities                            420        3,442     -87.80%
                Charitable gifts and donations                                    280         45       522.22%
                ECONOMIC VALUE RETAINED                                          5,742      17,492     -67.17%

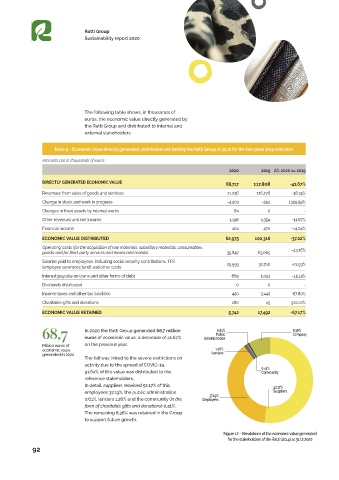
                68,7           In 2020 the Ratti Group generated 68,7 million   Administration          8.36%
                                                                             0.61%
                                                                                                        Company
                                                                             Public
                               euros of economic value, a decrease of 41.67%
                Million euros of   on the previous year.
                economic value                                               1.26%
                generated in 2020                                          Lenders
                               The fall was linked to the severe restrictions on
                               activity due to the spread of COVID-19.                       0.41%
                               91.64% of this value was distributed to the                   Community
                               reference stakeholders.
                               In detail, suppliers received 52.17% of this,                     52.17%
                               employees 37.19%, the public administration   37.19%              Suppliers
                               0.61%, lenders 1.26% and the community (in the   Employees
                               form of charitable gifts and donations) 0.41%.
                               The remaining 8.36% was retained in the Group
                               to support future growth.

                                                                                Figure 12 – Breakdown of the economic value generated
                                                                                 for the stakeholders of the Ratti Group at 31.12.2020
            92
   88   89   90   91   92   93   94   95   96   97   98