
Page 104 - Ratti_bilancio di sostenibilità_2021_en
P. 104
RATTI GROUP | SUSTAINABILITY REPORT 2021
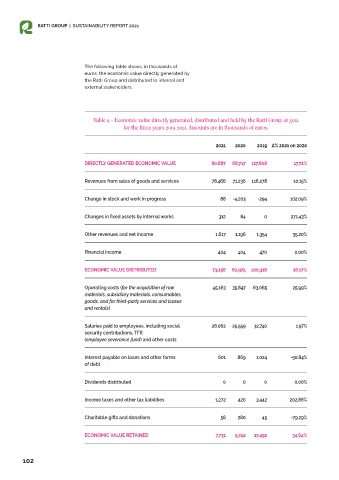
The following table shows, in thousands of
euros, the economic value directly generated by
the Ratti Group and distributed to internal and
external stakeholders.
Table 9 – Economic value directly generated, distributed and held by the Ratti Group at 31.12
for the three years 2019-2021. Amounts are in thousands of euros.
2021 2020 2019 Δ% 2021 on 2020
DIRECTLY GENERATED ECONOMIC VALUE 80,887 68,717 117,808 17.71%
Revenues from sales of goods and services 78,466 71,236 116,278 10.15%
Change in stock and work in progress 88 -4,203 -294 102.09%
Changes in fixed assets by internal works 312 84 0 271.43%
Other revenues and net income 1,617 1,196 1,354 35.20%
Financial income 404 404 470 0.00%
ECONOMIC VALUE DISTRIBUTED 73,156 62,975 100,316 16.17%
Operating costs (for the acquisition of raw 45,163 35,847 63,065 25.99%
materials, subsidiary materials, consumables,
goods, and for third-party services and leases
and rentals)
Salaries paid to employees, including social 26,062 25,559 32,740 1.97%
security contributions, TFR
(employee severance fund) and other costs
Interest payable on loans and other forms 601 869 1,024 -30.84%
of debt
Dividends distributed 0 0 0 0.00%
Income taxes and other tax liabilities 1,272 420 3,442 202.86%
Charitable gifts and donations 58 280 45 -79.29%
ECONOMIC VALUE RETAINED 7,731 5,742 17,492 34.64%
102